Scroll or use →  ·  swipe
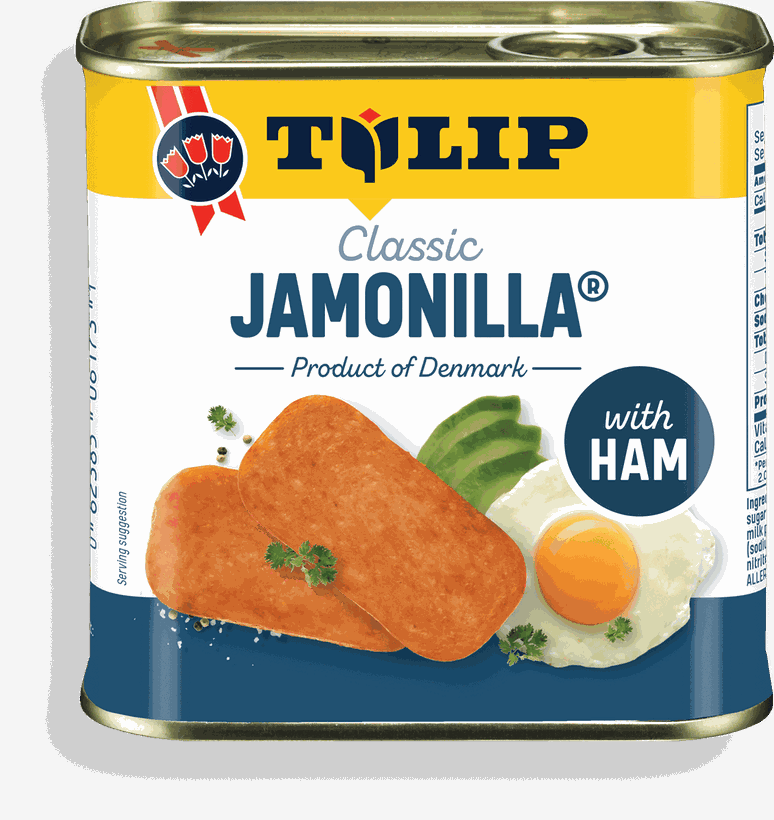
Tulip Classic Jamonilla
Danish Crown  ·  Tulip Jamonilla  ·  Philippines 2026

The campaign wrap

YOU MAKE
THE MOMENT.

15 creators. 36 posts live against 30 contracted. 3,186,518 views. This is what the content did, what it earned on its own, and what we would do next.

Phase 1 final report  ·  Prepared for Jakob R. V. Svendsen

First, the delivery

EVERYTHING SHIPPED.

All 15 creators filmed, posted and reposted. Every post carries the approved caption, the four hashtags and the partnership disclosure, each one checked at source rather than taken on trust.

36
posts live, against 30 contracted
15 / 15
creators delivered, nobody dropped out
6
Facebook posts added at no extra cost
4
platforms: TikTok, Instagram, Facebook, YouTube

The 6 extra posts were free. Creators who were enjoying the brief offered a Facebook cut as well, so the campaign delivered 6 more placements than the contract asked for.

The total, all sources
3,186,518
VIEWS.

Organic reach and Danish Crown's own paid delivery combined, across all 36 posts.

17,217
total engagements
3,536
saves
680
shares
241
comments

Each post is counted at its latest reported figure, taken from the creator's own analytics. Posts went live between 18 September and 13 October, so the older posts have had longer to mature.

So the numbers mean something

HOW WE MEASURE.

Engagement is measured against views, not followers. Most of the industry divides by follower count, which flatters every number. Views is the stricter denominator and the one we have used all campaign.
Posts are split by whether money sat behind them. Your SoMe team's own Meta and TikTok reports of 13 October name exactly which posts were boosted. We use that, not a guess.
Paid and organic cannot be separated inside a Spark ad. Boosted views land on the creator's own post, so a boosted post's public view count contains both. We never present a boosted number as earned.
The paid figures here are dated 13 October and your flights run to about 31 October. This report is the organic wrap. A short paid addendum follows once the flights close and the final spend is known.
The finding

WHAT THE CONTENT EARNED
ON ITS OWN.

Earned, no money behind it
284,393
views across 27 posts
4.55%
engagement rate
With your media behind it
2,902,125
views across 9 posts
0.15%
engagement rate

This gap is normal, and it is not a criticism of the buy. Paid delivery reaches people who never chose to follow the creator, so its engagement rate is always far lower. The two numbers answer different questions. Paid answers how many people we can reach. The 4.55% answers whether the content was any good, and that is the number that says yes.

Creator by creator, zero media, TikTok

TIKTOK BEAT BENCHMARK.

9 unboosted TikTok posts, 21,897 views, 5.2% engagement against a food and drink benchmark of 3.0 to 3.5%. Highlighted creators cleared the top of the benchmark range.

Creator
Views
Eng.
Saves
Eatnoggy
8,516
6.5%
40
Dith's Delight
455
5.9%
3
Janine Louise
534
5.6%
0
Jonah Leyson
2,751
5.5%
14
Kween Foodie Momshie
705
5.0%
2
Kiel Coronel
4,317
4.4%
15
Vincent
787
4.2%
4
Lara Aquino
543
3.3%
4
Panda Eatss
3,289
2.8%
7
Creator by creator, zero media, Instagram

INSTAGRAM DID IT TWICE OVER.

10 unboosted Instagram posts, 232,732 views, 5.0% engagement against a benchmark of 2.0 to 2.5%. Cooking Bae's reel carries most of the reach, and it was never boosted.

Creator
Views
Eng.
Saves
Vincent
1,144
5.9%
0
Cooking Bae
212,282
5.2%
2,700
Panda Eatss
1,862
5.0%
0
Lara Aquino
577
3.8%
2
Eatnoggy
3,683
3.7%
23
Jonah Leyson
894
3.7%
0
Dith's Delight
3,746
2.6%
12
The Wagstaffs
883
2.5%
0
Kween Foodie Momshie
2,214
0.6%
0
Kiel Coronel
5,447
0.3%
0
Best content in the campaign, and why

COOKING BAE'S REEL.

Her Instagram reel is the strongest asset the campaign produced, and on your SoMe team's 13 October report Meta had spent DKK 0.00 behind it. This is earned, not bought.

212,282
views, no media behind them
2,700
saves, which is 76% of every save in the campaign
5.2%
engagement, double the Instagram benchmark
8,090
likes

Why it worked. She cooks on camera the way she would with the phone propped against the kettle, so the recipe reads as something you could copy tonight rather than an ad you were served. The product does the job in the pan and she never announces it. That is the format to brief again.

The metric we would judge the next campaign on

SAVES, NOT VIEWS.

A view means the thumb paused. A save means somebody intends to cook it. For a product bought on a weekly shop, that is the closest free signal to purchase intent that any of these platforms give us.

3,536
saves across the campaign
82%
of them came from posts with no money behind them
680
shares, somebody sending it to someone else

The ranking by saves is almost the reverse of the ranking by views. That is the single most useful thing in this report for deciding where the next budget goes, and the next slide prices it.

Your own media, as reported 13 October

THE BUY WAS EFFICIENT.

Across Meta and TikTok your team spent DKK 2,331.52 and delivered 2,642,383 impressions. The cost per thousand ran from DKK 0.56 to DKK 0.94, which is cheap and, more to the point, nearly even across all five creators.

891.97
DKK on Meta, 989,415 impressions
1,439.55
DKK on TikTok, 1,652,968 impressions
1.7x
spread between the cheapest and dearest CPM

Two of the five Meta ad sets, Cooking Bae and The Wagstaffs, were still scheduled on 13 October and had not spent. The addendum will restate this once the flights close.

What this says about the next buy

THE IMPRESSIONS COST THE SAME.
THE ATTENTION DID NOT.

Same platform, same fortnight, five creators. The media bought impressions at within 1.7x of the same price. What those impressions were worth varied by 11x. The variable was the creative, not the buying.

TikTok Spark
DKK spent
CPM
Saves
DKK / save
Cooking Bae
345.34
0.82
477
0.72
Aimee Yap
17.26
0.56
8
2.16
Tukayo Cooking
83.97
0.63
23
3.65
Foodee Eats PH
463.55
0.94
67
6.92
The Wagstaffs
529.43
0.92
64
8.27

How we would use it. Put the next budget behind the posts that are already earning saves, and let views follow. On these numbers that means weighting toward Cooking Bae's kind of content and briefing more of it, rather than spreading the money evenly across a roster.

Asked for: what transfers to Korea

WHAT WE WOULD CARRY NORTH.

The sourcing is the proved part. Fifteen creators found, signed, briefed and delivered on your account, with nobody dropping out. That is the piece that usually fails, and it is now a known quantity.
Judge it on saves and reorders, not reach. The Philippines data says reach is cheap and attention is not. In Korea the equivalent hard number is cases reordered by the venues you serve.
Point it at food service, not the family table. Danish Crown sells roughly five times as much in Korean food service as in retail, and bar operators now need food that earns its own margin. Shelf stable, no chef, three minutes.
Anju, not army stew. Army stew is the most drinking dependent dish in Korea and it is falling with the venues that serve it. Anju is the bigger plate and canned ham is built for it. Detail is in the two pager we sent on 6 October.
Where we would go next

PHASE 2.

Brief fewer creators, deeper. The campaign's saves are concentrated in a handful of posts. Five creators making three posts each would beat fifteen making two.
Boost on the save rate, after a week. Let every post run organic for seven days, then put the money behind whatever is earning saves. The data to do that now exists.
Keep the Facebook cut in the contract. Creators gave 6 of them away free this time. It is worth asking for properly.
Creator usage runs to 14 December 2026. Worth knowing before the campaign film and the best performing posts go behind more spend.

Thank you for a genuinely good brief. Madiskarte gave fifteen people something true to make, and it shows in the engagement rate.

Wendy Wang  ·  Creative AI Marketing  ·  20 October 2026